


Analytical tool for cities
The analytical online tool was developed in order to provide cities and sub-national jurisdictions with the opportunity to conduct a quick assessment of their status on the key areas of SDG7 localisation process, identify areas for improvement and receive recommendations for action tailored to their specific local context.
In this online tool, seven indicators and eight sub-indicators are considered, which, in a qualitative manner, cover important areas of the local context in a jurisdiction in relation to SDG7 Localisation, such as: policy and institutional environment, capacity, stakeholder engagement, data collection, financial resources, implementation efforts and linkages to other SDGs. These qualitative indicators are used in the cities’ self-assessment of their capacity and availability of policies, actions and resources for supporting SDG7 localisation. It is important to note that these indicators are not for measurement of the level of cities’ achievement of the quantitative targets under the global SDG7.
SDG7 localisation indicators
|
|
Primary localization indicators |
 |
Available policies and institutions for SDG localization |
 |
Energy data monitoring |
 |
Cooperation with national and international stakeholders |
 |
Use of financial resources |
 |
Awareness raising and capacity- building |
 |
Implementation |
|
6.1 Energy access |
|
|
6.2 Renewable energy |
|
|
6.3 Energy efficiency |
|
 |
Linkages to other SDGs |
|
7.1 SDG 3. Good health and well-being. |
|
|
7.2 SDG 6. Clean water and sanitation. |
|
|
7.3 SDG 11. Sustainable cities and communities. |
|
|
7.4 SDG 12. Responsible production and consumption. |
|
|
7.5 SDG 13. Climate action. |
There are three important steps during utilisation of this tool:

DATA ENTRY
Users of the tool perform data entry by following the instructions and answering the questions of the online questionnaire.

DATA ANALYSIS
Provided answers are decoded into numeric values based on the meaning of the answer for the SDG7 localization process.

SNAPSHOT
PREPARATION
SDG7 Localisation snapshot, which presents the key results of the data analysis and recommendations, is automatically prepared upon submission of all answers.
Step 1
DATA ENTRY
After registration in the system users of the tool (i.e. representatives of provinces, municipalities, cities, districts, etc.) perform data entry by following instructions and answering questions of the online questionnaire. Questions included in the questionnaire are formulated in a way that allows for capturing the important information and qualitative data for each of the SDG7 Localisation indicators and sub-indicators, with multiple questions or sometimes different parts of questions contributing to different indicators. It is, therefore, crucial for the users to provide complete, reliable and accurate information, when answering the questions, as it has a direct impact on the robustness of the result and relevance of the recommendations. It is advised to consult various city departments, relevant institutions, and stakeholders (e.g. via a stakeholder consultation) to obtain the most accurate data. The questionnaire is structured in two main parts:
Part 1. Current status of SDG7 and other SDG-related indicators the cityDeveloped to prepare an overview of the local context across various areas related to SDG7 Localisation and “translate” the answers from the jurisdiction into qualitative scores (from 0 to 100) for each of the SDG7 localisation indicators.
Part 2. Implementation of sector specific and cross sectoral integrated urban solutionsDeveloped as a tracking tool on implementation of various sector specific and cross-sectoral energy efficient and renewable energy solutions, covering different energy end-users and energy generation facilities available in the jurisdiction. This part of the questionnaire is optional.
These two parts consisted of 45 questions in total with three types of questions such as simple binary questions, multiple answer questions, and open-end questions.
Main areas covered by the SDG7 Localization Questionnaire
- General Information
Location, climate, institutional capacity - Sustainable Energy
Energy generation and end-use, targets and regulations in the city, sector specific incentives and support - Healthy lives and well-being
Evaluation of healthcare facilitates with cooling space - Water management and sanitation
Quality, availability and support measures - Resilient city infrastructure
Living conditions, transport and pedestrian infrastructure availability, air pollution - Climate change and its impact
Availability of relevant plans and programs
Step 2
DATA ANALYSIS
Answers, provided to the questionnaire, are decoded into numeric values based on the meaning of the answer for the SDG7 localisation process, which are then aggregated into the overall score (between 0 and 100) for each SDG7 Localisation indicators and sub-indicators.
First, the score for each question is calculated, as a difference between the sum of the actual answers (in format of decoded numeric values) and the sum of maximum possible answers (with highest value). Each question has a pre-determined numerical ‘weight’ or contribution to one or more SDG7 indicators. Final score for each indicator is calculated as a weighted average between summarized actual scores for questions, related to selected indicator, and summarized maximum possible scores, related to selected indicator, multiplied by their respective ‘weights’.
The results for each indicator are presented as a nominal score from 0 to 100 (where 100 is the maximum possible score that can be achieved for each indicator or sub-indicator based on the aggregation of all answers to the questionnaire linked to this particular indicator). The higher the score on the scale from 0 to 100, the more efforts are currently being made in this particular area of the SDG7 Localisation process in the city. A relatively low score (e.g. lower than 60) indicates that there is a room for improvement and further actions should be taken in this area.
Step 3
SDG7 LOCALISATION SNAPSHOT
Key results of the data analysis for each city are synthesized in a concise manner and presented in SDG7 Localisation Snapshot, which is automatically generated by the tool after the answers to the questionnaire are submitted by the user. The results are organized around several diagrams to show the selected aspects of the SDG7 Localisation status in the city, followed by high-level recommendations tailored to the local context based on the analysis of the answers to the questionnaire and the resulting scores for the indicators.
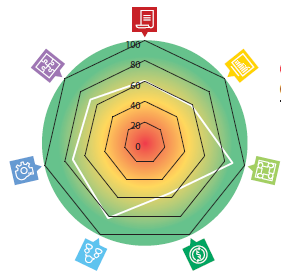
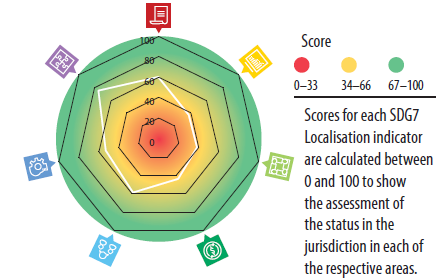
The main spider diagram of the SDG7 Localisation Snapshot presents the results for all seven SDG7 Localisation indicators at once. The diagram provides a visual picture of how a jurisdiction performs in each of these areas based on the overall nominal score (from 0 to 100) calculated for each indicator: the farther the score is from the maximum 100 points, the more room there is for improvements in this particular area of the SDG7 localisation process.


SDG7 Localisation Snapshot also investigates more specific areas of local efforts, crucial for an effective SDG7 Localisation process, such as:
- SDG7 commitments and institutional capacity in the jurisdiction.
- Assessment of energy access
- Assessment of results of energy efficient and renewable energy technologies
- Implementation of SDG7 support targets and policies
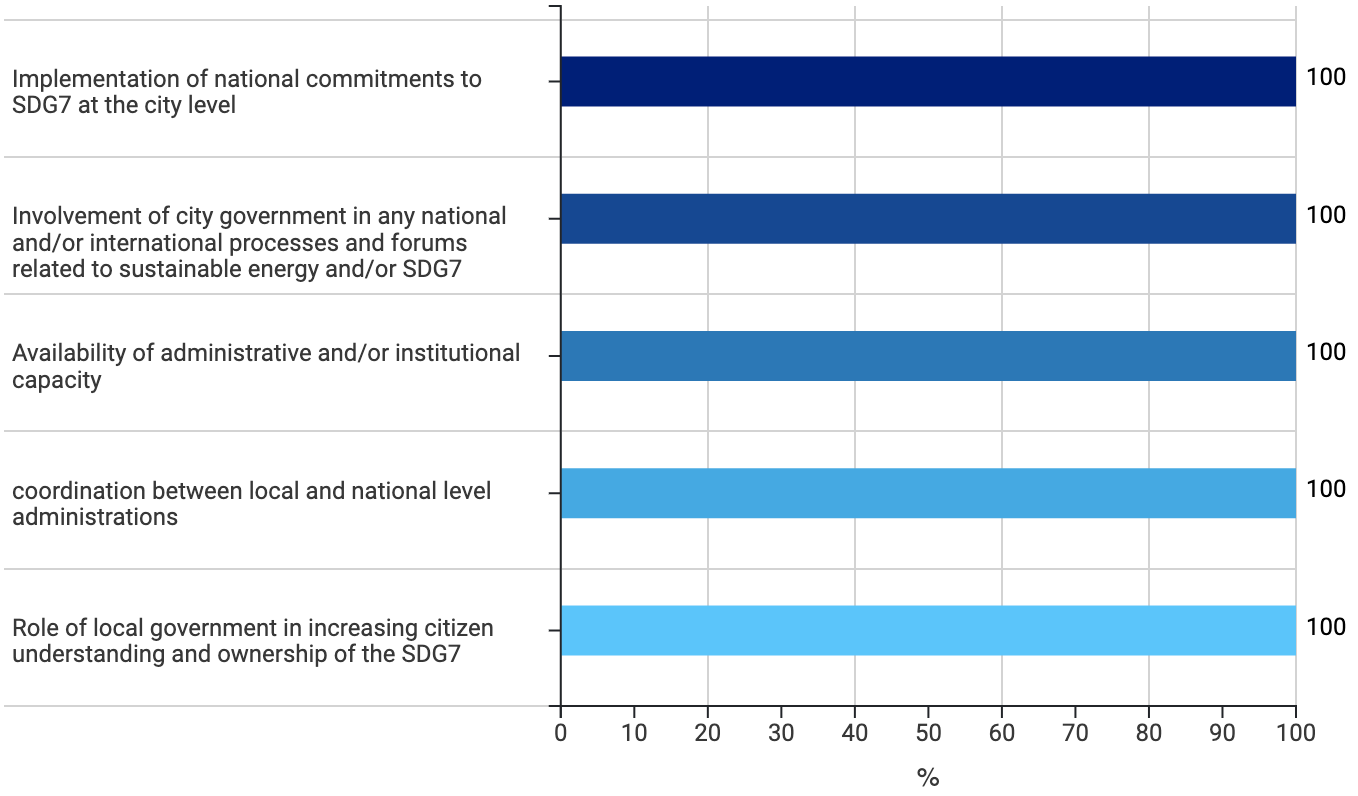
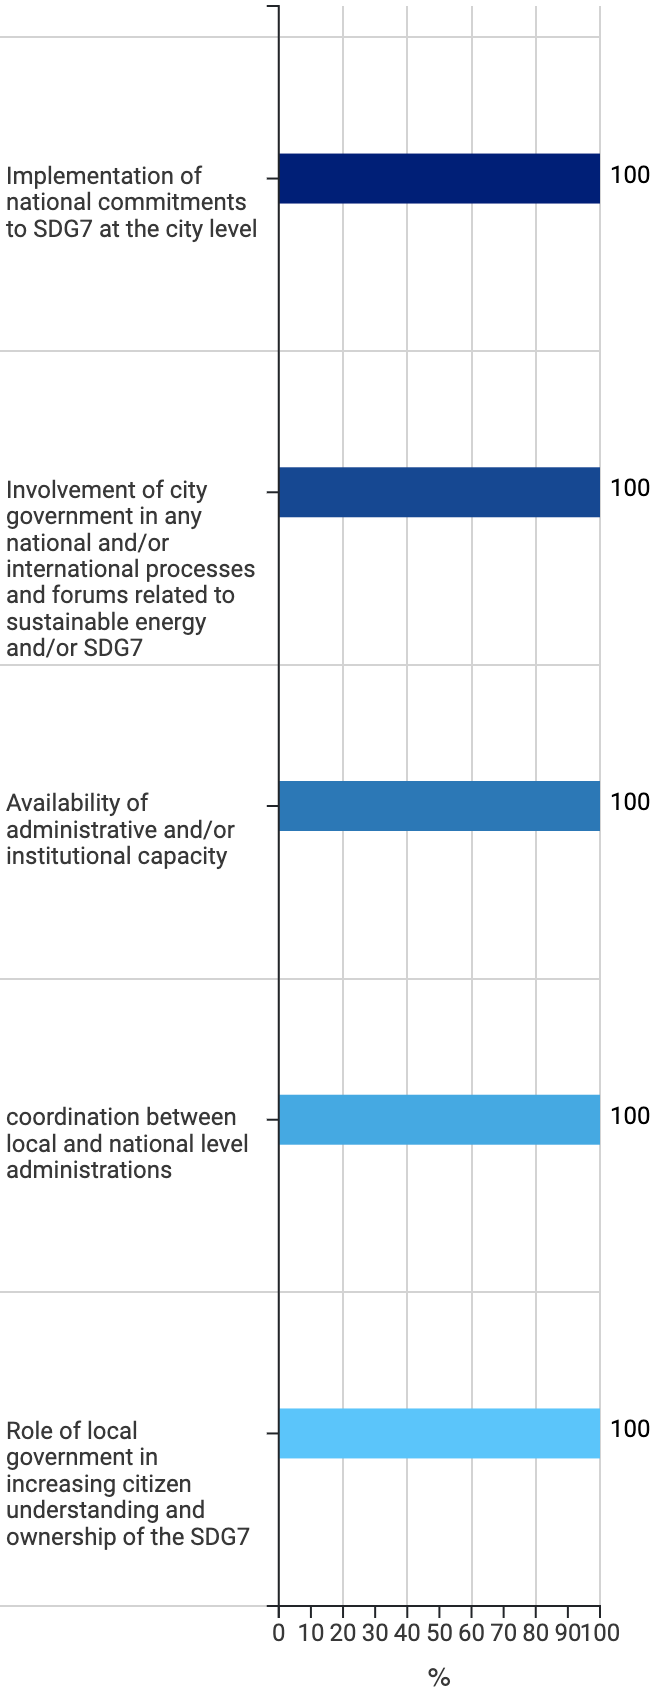
This figure above presents an example of results for SDG7 commitments and institutional capacity. The aim of this figure is to assess the work that the local government is doing in collaboration with the national government in relation to SDG7 implementation, the alignment between national and local commitments on SDG7 and any existing coordination mechanisms between different levels of governance, which are crucial for effective implementation of the actions toward achievement of SDG7. The city can lead by example and set its own targets and commitments on SDG7 (which might be even more ambitious than the national ones) or implement targets similar to the ones set at the national level. In any case, the effectiveness of SDGs localisation increases if there are mechanisms for coordination and communication regarding SDG-related efforts at the national and local levels.
Local capacity to implement actions and follow through on the commitments is another crucial success factor of SDG localisation, which is also covered in the figure. Effective SDG7 localisation is not possible without having general public on board, making choices and adjusting their behaviour in support of sustainable energy. Local governments are well-positioned to play a key role in improving citizens’ understanding and knowledge of SDG7 and the importance of related actions, which can be taken by everyone. Awareness raising campaigns, educational programmes and professional training programmes for different groups of people are important tools, which can be used by local governments to make improvements in this area.
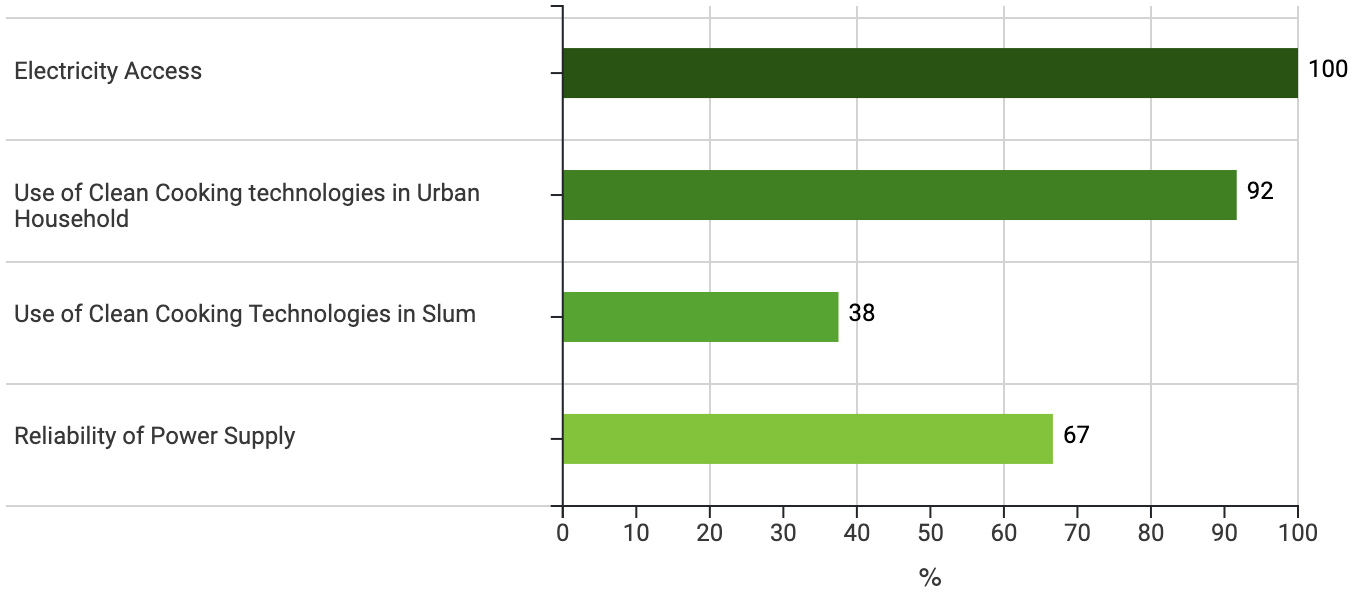
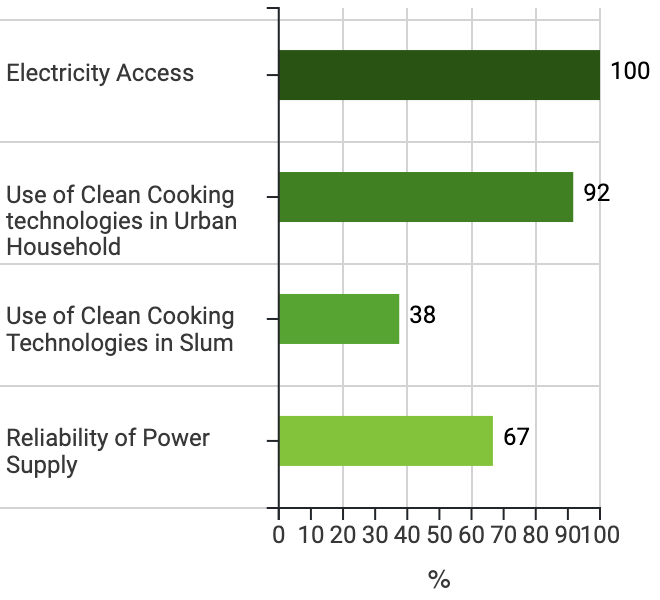

SDG7 Localisation Snapshot also presents assessment results on the main areas of SDG7 implementaion: energy access, renewable energy and enegry efficiency.
The figure demonstrating the example of results on energy access covers three main aspects of this area: electricity access, reliability of power supply, and use of clean cooking methods in urban household as well as slums and informal settlements.
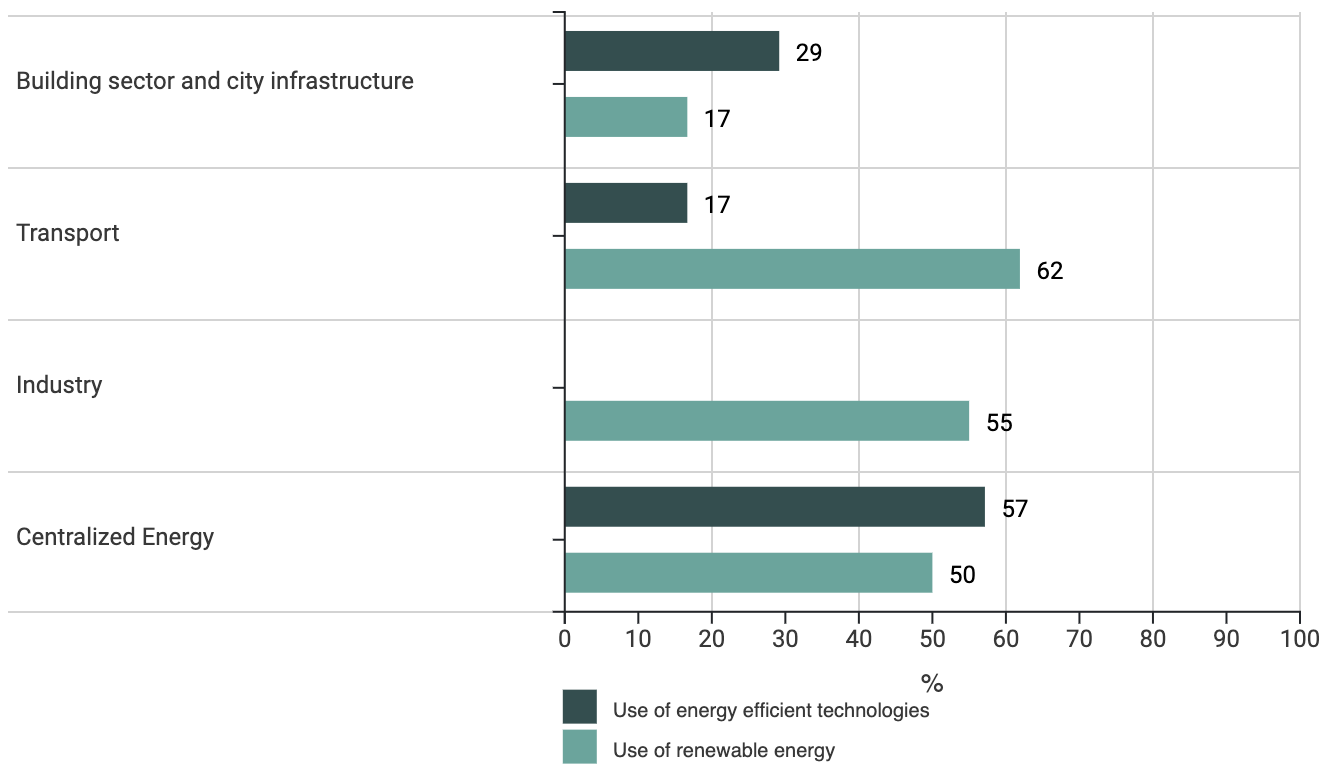
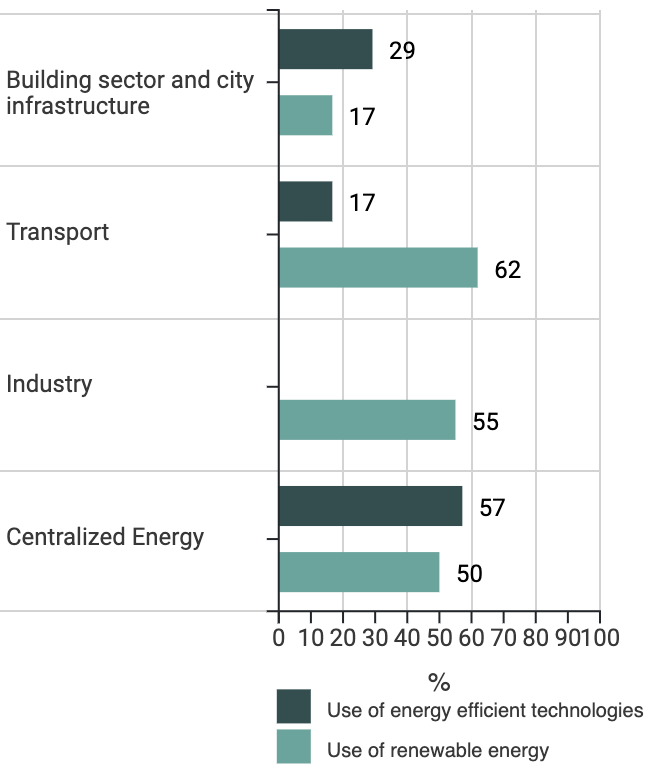
The scores resulting from city’s self-assessment regarding utilisation of energy efficient and renewable energy technologies are presented for four end-use sectors: buildings and infrastructure, transport, industry, and centralised energy. The results in the figure above show that renewable energy is widely used in the transport sector and centralised energy, but there is still room for improvement in buildings and infrastructure, as well as in the industry sector. The level of utilisation of energy efficient technologies is moderate across all sectors.

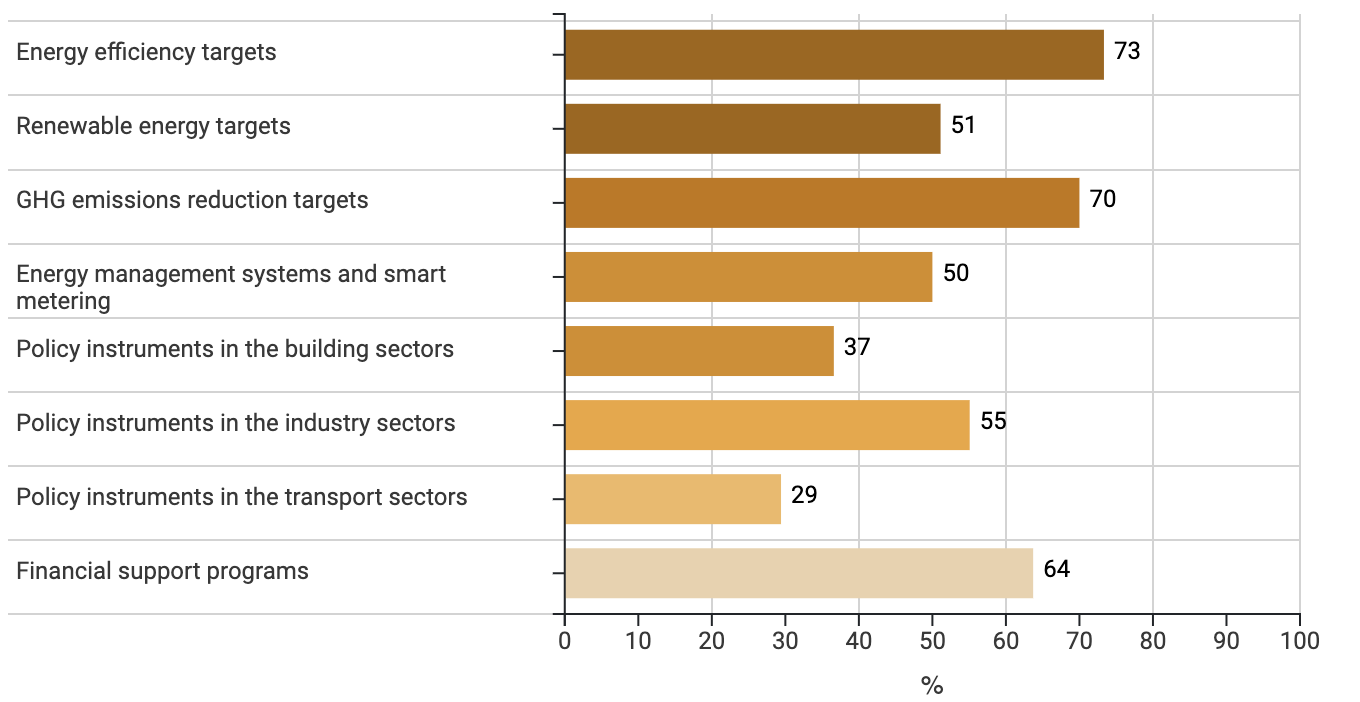
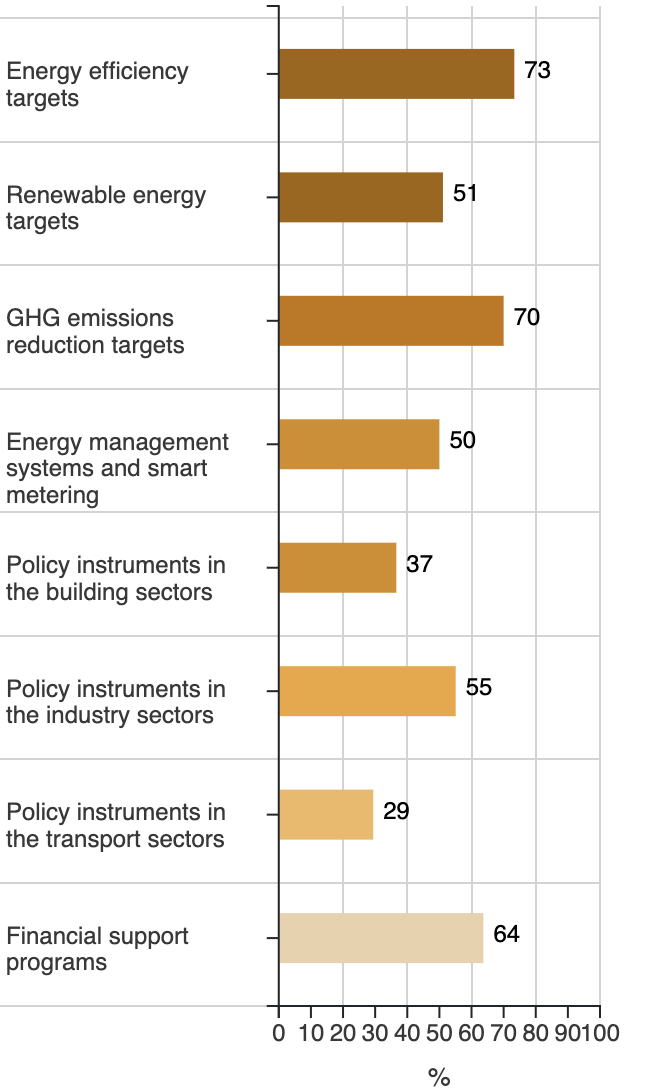
A separate figure focuses on the results on the implementation of SDG7 support targets, key regulations and policies. This diagram covers energy efficiency targets, renewable energy targets, GHG emissions reduction targets, energy management systems and smart metering, policy instruments in building, industry, and transport sectors, and financial support programmes, which were aggregated from answers to multiple questions of the questionnaire based on cities’ assessments of the implementation of various types of policies locally. In the example shown above the results across the categories of policy instruments are consistently low except for GHG emissions reduction targets and the transport sector. These results demonstrate the importance of additional efforts of the city on setting sustainable energy targets, establishing energy management systems and developing policy packages for buildings and industry. Particular focus should be placed on unlocking access to finance for implementation of sustainable energy policies and projects.
SDG7 Localisation Snapshot also includes a set of recommendations for further improvements for each of the SDG7 Localisation indicators and sub-indicators. The recommendations are tailored to the local context of the jurisdiction based on the answers provided in the tool and the results of the data analysis. The databases of possible high-level recommendations for different levels of scores for various questions of the city's self-assessment is an integral part of the tool on SDG7 Localisation. Depending on the score calculated for each question, a recommendation is provided from the respective score range. There are three to five pre-defined recommendations for each question based on levels of resulting scores. Also, the methodology was designed to provide tailor-made or personalised recommendations based on the city’s answers in some of the questions.
